Israeli military operations in Gaza and their humanitarian consequences following the Hamas attack on October 7, 2023, have sparked public debate over trade sanctions against Israel. As of July 2024, Israel’s offensive has killed more than 37,000 Palestinians. If indirect deaths from factors such as damage to medical infrastructure or food and water shortages are taken into account, the number could rise to more than 186,000. Seventy percent of the houses in Gaza were destroyed and 80 percent of the population was displaced. In response, Turkey suspended trade, while other countries including Belgium, Canada, Italy, Japan, the Netherlands and Spain also decided to halt arms trade. In Europe, the governments of Belgium, Ireland and Spain have openly advocated trade sanctions. The issue was also raised at the EU Foreign Affairs Council.
Economic sanctions have become an important tool in contemporary foreign policy. As of 2023, the United Nations administers 14 ongoing sanctions, while the United States has imposed more than 25 sanctions since the early 2000s. Research on effectiveness shows that economic sanctions are effective when they impose substantial economic costs on the target economy, are multilateral, are led by international institutions, aim for modest policy changes rather than ambitious goals, target allies rather than adversaries, and It is against democratic regimes.
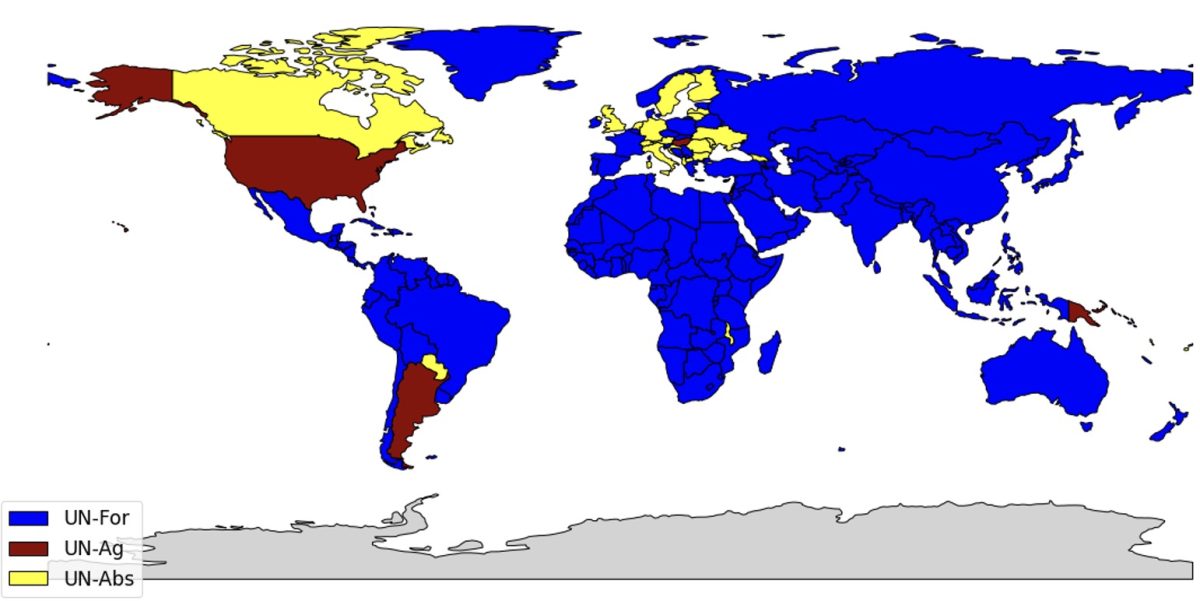
In this analysis, I use a multi-country, multi-sector trade model to examine the impact of tariff sanctions on Israel. This model is based on De Souza et al. (2024), Caliendo and Parro (2015) and Ossa (2014). Firms in each country competitively produce tradable goods in different sectors, both for final consumption and as factors of production along with labor and intermediate inputs. Trade is affected by iceberg costs as well as import and export tariffs set by governments. I calibrate the model using OECD intercountry input-output tables, a data set that describes interdependencies among 45 economic sectors and 76 countries. I divided countries into four groups based on their votes on the Palestinian accession resolution to the United Nations (A/ES-10/L.30/Rev.1): Israel, those who voted against the resolution (abbreviated “UN-Ag”) countries, the United States, Argentina, Hungary and other 9 countries), countries that voted in favor of the resolution (referred to as “UN-For”, 143 countries including China, France, Japan, etc.), countries that abstained from voting (referred to as “UN-Abs” , 25 countries) including the United Kingdom, Germany, Italy, and Canada). Figure 1 shows a map of countries based on different voting profiles.
I think the sanctioning countries are countries in the “UN-For” organization. I admit that this assumption is largely arbitrary. The question of which countries are more likely to impose sanctions is beyond the scope of this analysis. The aim here is to assess the impact of such sanctions. I compare this group to other hypothetical coalitions of sanctioning countries: the EU, BRICS (Brazil, Russia, India, China, South Africa) and the United States. Finally, while I focus here on the economic consequences of import and export tariffs, economic sanctions can also be imposed through a variety of other means, including asset freezes, financial market sanctions, or entry restrictions on key government officials and business executives.
The results shown in Table 1 indicate that the impact of export tariffs is slightly greater than that of import tariffs. If import tariffs change by 20%, Israel’s gross national income (GNI) will decrease by 1.31%, or up to 2.20% if imports are banned. If the export tariff changes by 20%, it will fall by 1.46%, and if there is an export ban, it will fall by 2.77%. When the two measures (import and export tariffs) are combined, the reduction ranges from 2.50% (20% tariff) to 4.15% (trade embargo). Finally, in all cases, the impact of sanctions on other countries (both sanctioned and non-sanctioned) is negligible, around -0.02%. This means there are no economic trade-offs in tariff levels: it is a political choice.
Table 2 compares the results for different coalitions of sanctioning countries. A 20% increase in EU import and export tariffs will reduce Israel’s GNI by 1.02%. The BRICS countries also increased, with a decrease of 0.77%, which is roughly the same as that of the United States (0.75%). In comparison, the impact of the EU trade embargo is -1.81%, the impact of the BRICS trade embargo is -1.31%, and the impact of the US trade embargo is -1.37%. In the extreme case, if all countries in the world participated in the trade embargo, the impact would be -7.33%. This shows that the larger the coalition imposing sanctions, the more significant the economic impact.
These values are within the range of Neuenkirch and Neumeier (2015), who estimate that the impact of “harsh” UN sanctions, such as a complete embargo imposed by a UN member state on a target country, is approximately -5% to -6% on GDP growth. They are also consistent with the prediction of the Armington model that the welfare benefits from trade should be at least equal to 1 − λ−1/e, where λ is one minus import penetration and ε is trade elasticity. Israel’s import penetration rate is 17%, so λ=0.83 and the trade elasticity is about -5, which means that the welfare loss caused by the embargo is at least 3.66%.
Table 3 shows the impact of sanctions on trade between Israel and other countries. United Nations – For imposing a 20% import (or export) tariff would reduce Israel’s exports (or imports) to these countries by 52.92% (or 52.71%). This will be partially offset by increased Israeli exports (or imports) to non-sanctioned countries: 30.59% more exports to UN-Ag and 31.03% more exports to UN-Abs (23.98% more exports from UN-Ag and 23.98% more from UN-Abs, respectively). Ab export increased by 24.82%) – Abs).
I now look at the breakdown of the impact of trade sanctions by sector. I assume that the sanctioning countries will increase import and export tariffs by 20%, and Israel will not impose any counter-sanctions. I also assume that food and medicine will not be sanctioned.
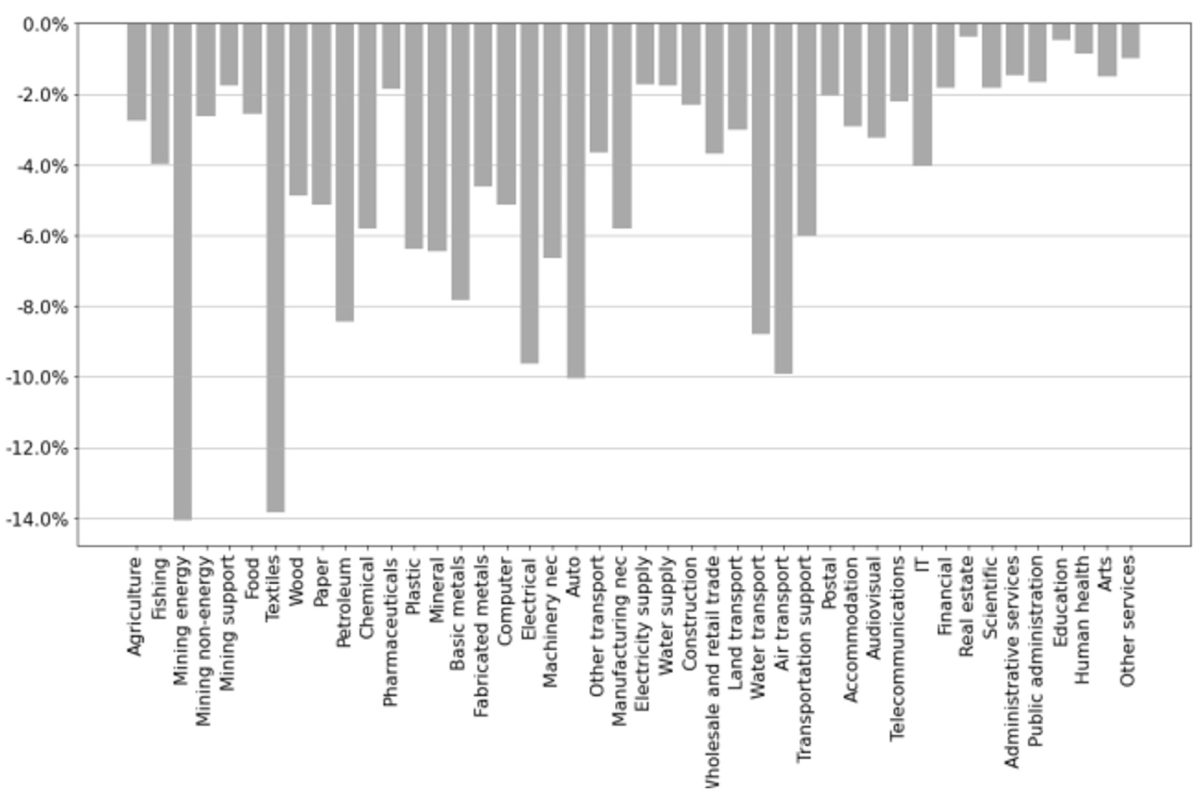
Figure 2 shows changes in the purchasing power of wages (PPW) across different sectors. It reveals how much the quantity of goods or services that can be purchased per unit of wages has changed in each sector as a result of sanctions. The industries with the most significant declines in PPW were fossil fuels (-14.07%) and textiles (-13.83%). Refined petroleum (-8.43%) was also significantly impacted due to the impact on fossil fuels. Other industries with sharp declines include automobiles (-10.06%), air transport (-9.92%) and electrical equipment (-9.63%). The impact on essential goods such as food (-2.58%), medicines (-1.85%) and electricity (-1.73%) remains moderate.
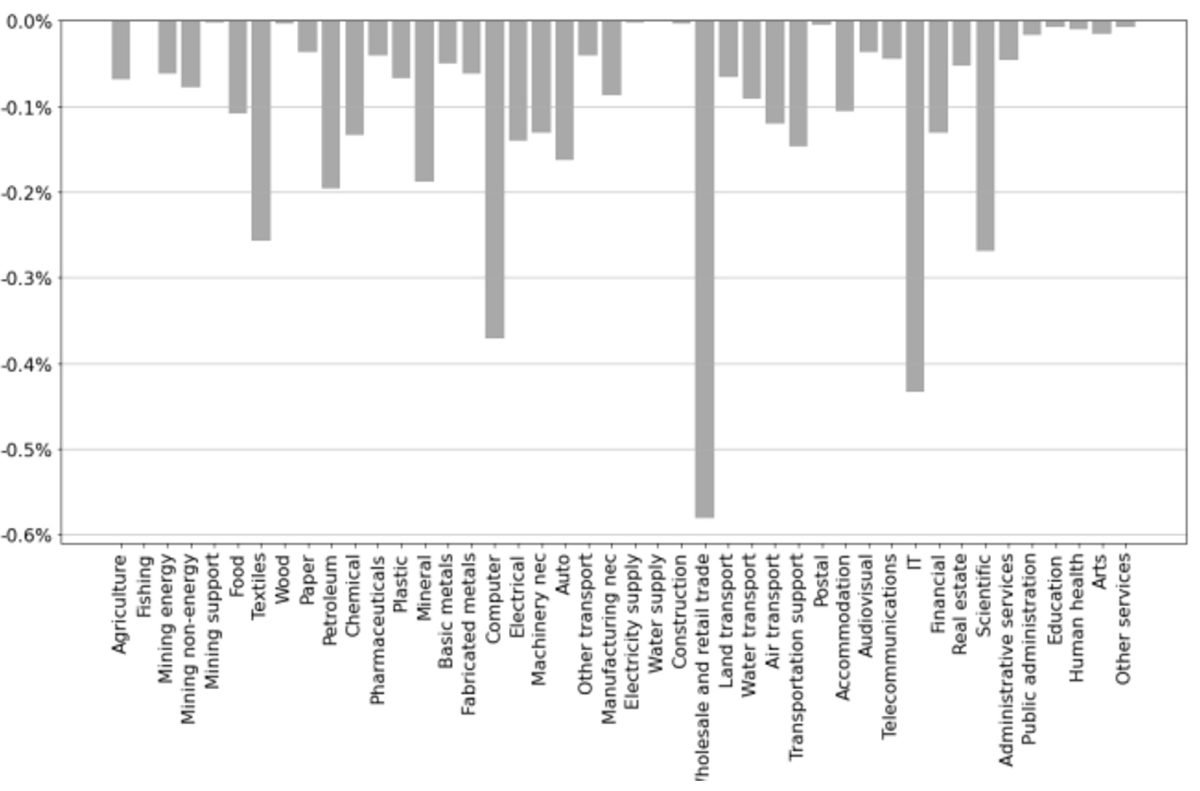
Finally, I examine which sectors are most effectively targeted by sector-specific sanctions. Figure 3 shows the changes in Israel’s gross national income as a result of the trade embargo in various sectors. Sectors where targeted sanctions are most effective include wholesale and retail trade, information technology (IT), computer and scientific services. The last three sectors emphasize Israel’s dependence on its high-tech economy. As of 2022, the high-tech industry will account for 18.1% of Israel’s GDP, an increase of 4 percentage points from 2012, making it the leading sector of the country’s economy. High technology also accounts for 48.3% of Israel’s exports, a figure that has more than doubled in the past decade.
The results of this study indicate that tariff sanctions could have a significant impact on Israel’s gross national income. Sanctions have been found to be more effective when they involve a large number of sanctioning countries and target high-tech products and services.
tables and figures
Figure 1: Map based on countries’ votes on the resolution admitting Palestine to United Nations membership (A/ES-10/L.30/Rev.1).

Figure 2: Changes in wage purchasing power by sector.

Figure 3: Impact of sector-specific trade embargoes on gross national income, by sector.

Table 1: Changes in Israel’s gross national income as a result of various tariff changes.
Note: Import sanctions are equivalent to the sanctions alliance raising import tariffs. Export sanctions correspond to increases in export tariffs by the Sanctioning Alliance.

Table 2: Changes in Israel’s gross national income by sanctions coalition.

Table 3: Impact of tariff sanctions on Israel’s imports and exports.

Further reading on electronic international relations

